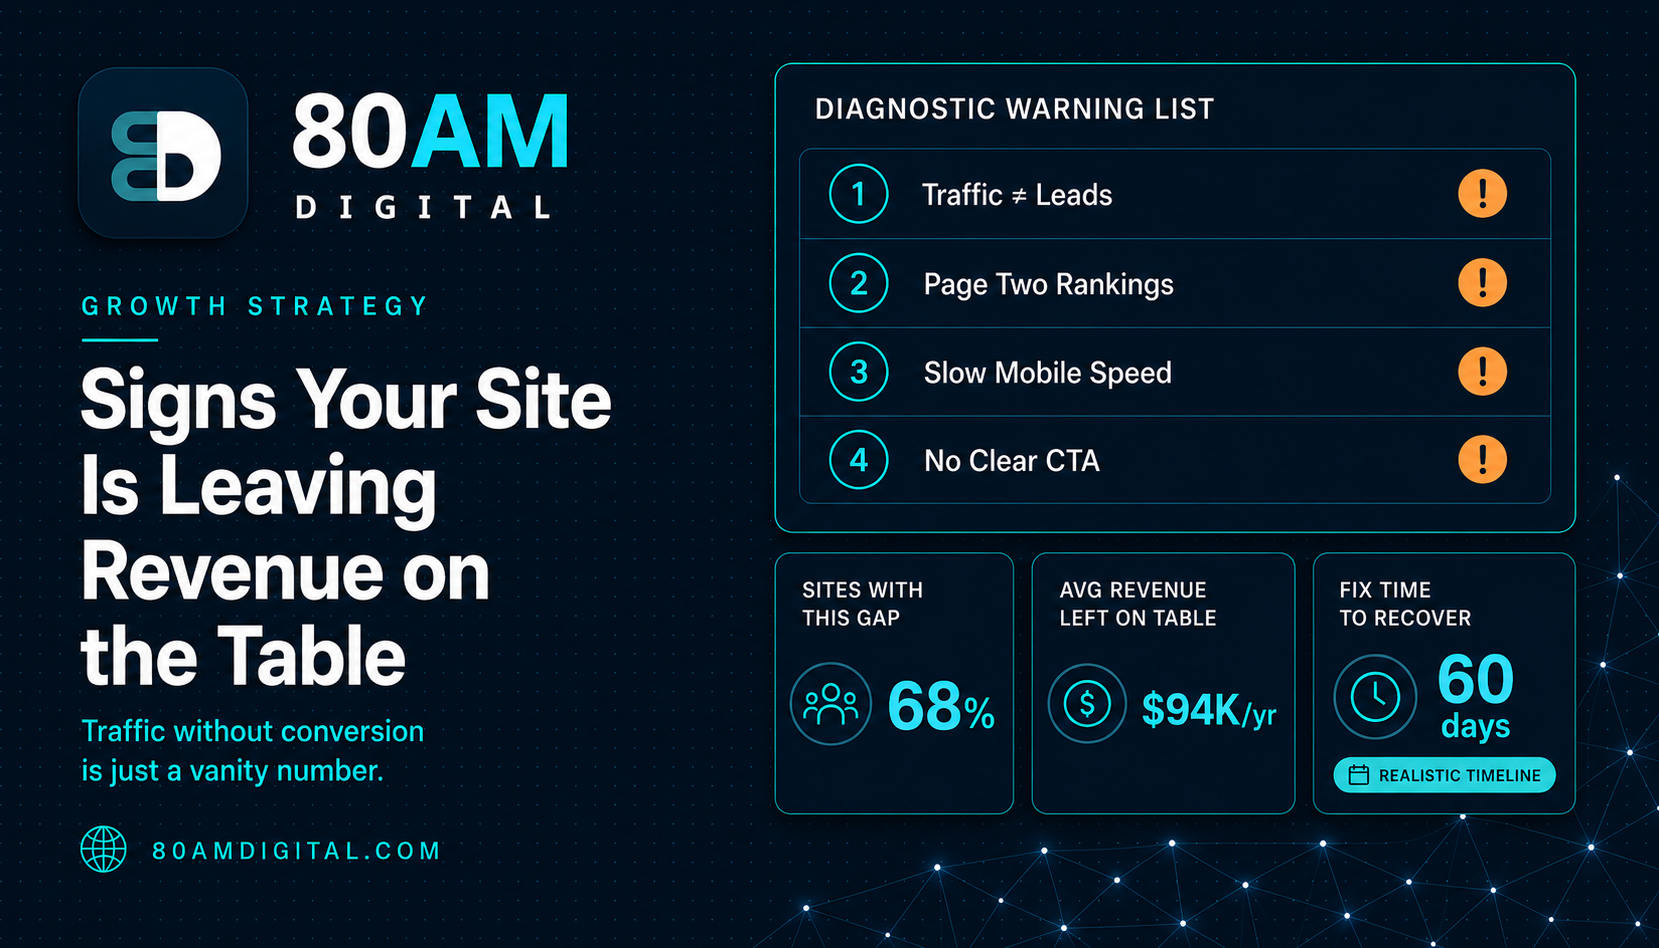
Signs Your Site Is Leaving Revenue on the Table
Slow pages, thin content, weak conversion paths—each quietly leaks revenue. Learn the warning signs your website is underperforming and where to look first.
Most websites don’t fail catastrophically. They underperform quietly — collecting visitors who never convert, ranking on page two for terms that could be page one, losing sales to a slow mobile experience, or routing traffic to pages that don’t give visitors a reason to act.
None of these problems announce themselves. They just sit in the data, draining revenue that could have been earned. These are the seven warning signs that reliably indicate a site is underperforming, where to look first when you find them, and a worked example of what fixing them actually returns.
The Short Version
Seven quiet revenue leaks to check: traffic growing without leads, key pages stuck on page two, mobile Core Web Vitals failures, a homepage that doesn’t clearly say what you do, content with no CTA, a content library with breadth but no topical depth, and a service page converting below what its traffic warrants. All seven are diagnosable with free tools (Search Console, GA4, PageSpeed Insights) — the fix starts with knowing where to look, not with a bigger budget.
Table of Contents
The Seven Warning Signs
| # | Warning sign | Check first in |
|---|---|---|
| 1 | Traffic growing, leads flat | GA4 + Search Console |
| 2 | Key pages stuck on page two | Search Console |
| 3 | Mobile Core Web Vitals failing | Search Console + GA4 |
| 4 | Vague homepage messaging | GA4 + manual review |
| 5 | High-traffic content with no CTA | GA4 |
| 6 | Breadth without topical depth | Search Console |
| 7 | Service page under-converting | GA4 |
1. Traffic Is Growing but Leads Aren’t
If organic sessions are climbing month over month but lead volume or sales aren’t following, the traffic is coming from the wrong queries, landing on the wrong pages, or reaching pages that don’t convert it.
Where to look: In GA4, check which pages organic traffic lands on and what the conversion rate is on each. Cross-reference with Search Console to see which queries are generating impressions — are they commercial queries (“hire SEO consultant”) or informational ones (“what is SEO”)? Traffic growth from informational content without commercial intent is noise if it’s not being routed toward conversion paths.
2. Key Pages Are on Page Two
The difference in click-through rate between position 8 and position 3 is enormous — roughly a 2% CTR versus a 10–15% CTR. A page sitting just off page one for a high-value keyword is generating a fraction of the traffic it would at a top-three position. That gap is revenue that exists in the search results but isn’t reaching the site.
Where to look: In Search Console, filter for queries where your average position is between 5 and 15. Sort by impressions. These are the keywords where small improvements — better internal linking, refreshed content, improved meta title CTR — produce the largest traffic gains for the least work. This is the highest-ROI optimisation exercise available on most sites.
3. Mobile Performance Is Failing Core Web Vitals
If Core Web Vitals are failing — particularly LCP (slow page load) or INP (slow interactivity) on mobile — the site is ranking below where it could be on Google’s mobile-first index, and converting fewer of the visitors it does receive. Mobile accounts for the majority of organic search traffic on most consumer-facing sites.
Where to look: Search Console → Page Experience → Core Web Vitals. Filter for “Poor” URLs on mobile. Cross-reference with GA4 to identify which of those underperforming pages receive the most organic mobile traffic. Those are the pages where a performance fix produces the fastest combined ranking and conversion improvement.
4. The Homepage Doesn’t Clearly State What You Do
A homepage that’s beautiful but vague is one of the most consistent conversion killers on service and B2B sites. If a visitor can’t state in one sentence what the company does and who it serves after ten seconds on the page, the homepage is failing — regardless of how it looks.
Where to look: GA4 → Landing Pages, filter to homepage, check engagement rate and scroll depth. Then read the homepage headline as if you’d never heard of the company. Does it answer: what do you do, for whom, and why does it matter? If the answer requires reading four paragraphs, revenue is leaking at the first impression.
5. Content Earns Traffic but Has No CTA
Blog posts and articles that generate organic traffic are commercial assets — not just brand builders. A post that earns three thousand visits a month from readers considering your type of service, but ends with no clear next step, is producing an audience that evaporates. Those visitors came, read, and left with no path to becoming a customer.
Where to look: Pull the list of top-traffic pages in GA4 from organic. Check each one: is there a CTA that connects the content to a commercial action (contact, service page, consultation)? If not, add one — this is one of the fastest revenue improvements available without producing new content.
6. The Site Has Significant Content But Low Topical Authority
A content library of fifty disconnected posts covering a wide range of loosely related topics does not signal topical authority — it signals breadth without depth. Google rewards sites that demonstrate consistent, comprehensive expertise in a specific area.
Where to look: Pull your top 30 ranking pages from Search Console. Do they cluster around a few specific topics? Or are they scattered across dozens of different subject areas with no clear connection? If the latter, revenue is being left on the table because the content isn’t building the authority signal needed to rank for the higher-value commercial keywords.
7. The Service Page Doesn’t Convert at the Rate Traffic Warrants
A service page with significant organic and direct traffic converting at under 2% usually has a structural problem: the offer isn’t clear, the proof isn’t convincing, the CTA is competing with other options, or the page is slow. Each percentage point improvement in conversion rate on a high-traffic service page is a direct revenue multiplier.
Where to look: GA4 → Landing Pages, filter for your service page URL and organic/direct traffic. What’s the session conversion rate? If it’s under 2% and the page is receiving substantial traffic, the conversion path is the bottleneck — not traffic volume.
For deeper diagnosis on specific pages, see the seven most common conversion blockers and the landing page teardown.
A Worked Example
A commercial cleaning services company had organic sessions up 28% year over year but lead volume flat — exactly warning sign #1. Running the full seven-point check found three compounding issues on the same set of pages: their core service pages averaged position 9–12 for the highest-value local commercial terms (#2), the homepage led with a generic “Excellence in Facility Services” headline that said nothing about what they actually did or for whom (#4), and the service pages converting visitors that did arrive sat at 1.1% against a reasonable target of 3%+ for the category (#7).
The team prioritised in the order the bottlenecks appeared in the funnel: rewrote the homepage headline to name the specific service and audience directly, refreshed and added internal links to the 8 highest-impression service pages stuck in positions 9–12, and rebuilt the service page CTA and proof section to address the specific objections prospects raised on sales calls.
Within four months, average position on the 8 target pages improved to 4–7, service page conversion rate rose to 2.8%, and — despite organic sessions growing only modestly further — lead volume rose 61%, finally tracking with the traffic growth that had been disconnected from it for over a year. None of the fixes required new content; all three were corrections to what already existed.
Frequently Asked Questions
The Quietest Problems Are the Most Expensive
None of the warning signs above make noise. They don’t trigger alerts or break anything visibly. They just quietly cost revenue month after month while the dashboard shows traffic numbers that look fine at first glance.
The fix starts with knowing where to look. If you’d like a second set of eyes on your site — someone to run through the diagnostic and tell you specifically what’s limiting performance — request an audit and we’ll send back a prioritised plan.