Search Console: The Underused Reports That Find Quick Wins
Most people only glance at Search Console’s top numbers. Learn the underused reports and filters that surface striking-distance keywords and fast ranking wins.
Most people open Search Console, look at the total clicks chart, and close it. That top-line number tells you almost nothing about where your rankings are gaining or losing ground — and nothing at all about which specific pages or keywords are worth acting on this week.
Search Console contains several reports that do exactly that job — but they require knowing where to look and how to filter. This guide walks through the views and filters that consistently surface actionable findings, including the “striking distance” keyword opportunity that almost every site has and most never act on.
The Short Version
Most value in Search Console hides behind four underused views: the striking-distance filter (position 4–15, sorted by impressions) for quick ranking wins, the date-comparison view for catching traffic decay early, the high-impression/low-CTR filter for meta title fixes, and the Coverage/Indexing report for crawl and indexation problems. None of these require new content — just acting on data that’s already sitting there.
Table of Contents
| Filter / report | What it finds | Action |
|---|---|---|
| Striking distance (position 4–15) | Keywords almost ranking on page one | Refresh content, add internal links, add schema |
| Date comparison (6M vs prior 6M) | Pages losing traffic and position | Content refresh audit |
| High impressions, low CTR | Pages with a meta title/description problem | Rewrite title and description |
| Coverage / Indexing | Pages excluded or wrongly indexed | Consolidate, link internally, or fix robots/noindex |
| Page Experience | Pages with poor Core Web Vitals | Prioritise fixes on high-traffic mobile pages |
The Performance Report: Beyond the Default View
The Performance report is where most useful data lives. The default view — total clicks and impressions over 3 months — is a baseline, not an analysis. Here’s where to go instead:
Filter: Queries Ranking 4–15 (Striking Distance)
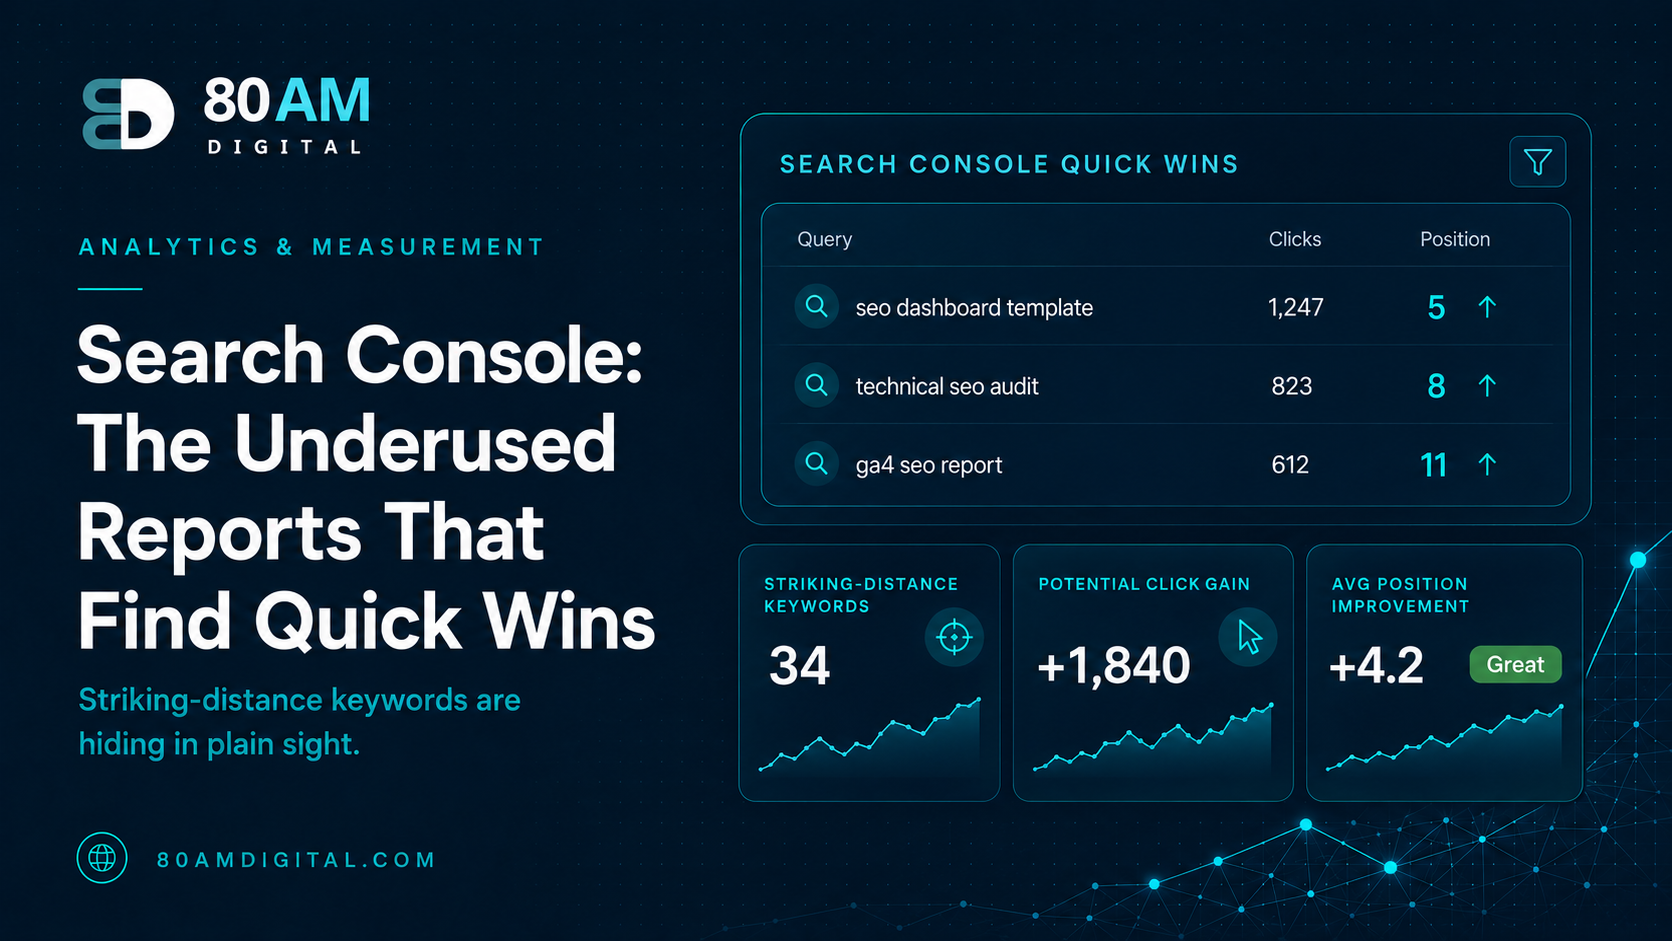
This is the highest-value filter in Search Console. In the Performance report, click “Average Position” to add it to the chart, then use the filter bar to add: Position > 3 and Position ≤ 15. This narrows the query list to keywords where you’re ranking on page one but not in the top three — or just off page one.
Sort by Impressions (descending). The keywords at the top of the resulting list are getting significant searches, you’re already visible for them, and a small position improvement — from 8 to 4, or from 12 to 7 — would produce a meaningful click increase. These are the highest-ROI optimisation targets on any site.
What drives a position improvement for these queries: refreshing the content for completeness, improving internal links to the ranking page, and adding schema where relevant. No new content needed — just improving what already ranks.
Filter: Date Comparison (6M vs. Previous 6M)
The date comparison view is where you find decay early. In the Performance report, click the date range selector and choose “Compare.” Set a 6-month vs. previous 6-month comparison. Then sort the Pages tab by “Difference in Clicks” (ascending) to surface the pages that lost the most traffic.
These are the pages most in need of a content refresh audit. For each, check: has the ranking position dropped? Has impression volume held steady (suggesting the topic is still searched, but you’re losing to competitors)? That combination — declining clicks, stable impressions, falling position — is a clear signal to investigate the page’s content relative to what’s now ranking above it.
Filter: Pages with High Impressions, Low CTR
In the Queries or Pages tab, add CTR to the display and sort by Impressions descending. Look for pages with significant impressions but a CTR well below the industry average for their position (roughly: position 1 = 25–30% CTR; position 5 = 6–8%; position 10 = 2–3%).
Low CTR at a given position usually means the meta title or description isn’t earning the click. Fix: rewrite the meta title to be more specific and benefit-focused; update the meta description to directly address the searcher’s intent. This is one of the few optimisations that shows results within days of re-indexing.
The Index Coverage Report
The Coverage report (now called “Indexing” in the newer GSC interface) shows which pages are indexed, which are excluded, and why. Check it monthly.
The findings worth acting on:
- Excluded: “Crawled — currently not indexed” — Google has seen the page but decided not to index it. This is a quality signal: these pages may be too thin, too similar to other pages on the site, or not adding sufficient value. Review them for consolidation or improvement.
- Excluded: “Discovered — currently not indexed” — Google knows the page exists (from the sitemap or internal links) but hasn’t crawled it yet. Often a crawl budget indicator. Check that the affected pages are internally linked and not buried deep in the site architecture.
- Valid with Warning: “Indexed, though blocked by robots.txt” — Pages that are indexed but shouldn’t be. Review your robots.txt and noindex directives.
The Page Experience Report
The Page Experience report shows Core Web Vitals data segmented by URL, including LCP, INP, and CLS assessments from the Chrome User Experience Report (real-user data, not lab data). Use it to find which specific pages are underperforming on experience metrics — particularly mobile.
Filter by “Poor” URLs and sort by the number of origin-sample URLs affected. Pages with large mobile traffic and poor Core Web Vitals are the highest-priority fixes — they’re the pages where ranking potential is directly constrained by experience metrics.
The Links Report
Under Links → External Links → Top Linked Pages, you’ll see which pages are receiving the most inbound links. Cross-reference this with your performance data: the pages with the most external links that aren’t receiving corresponding internal links to related content and conversion pages represent untapped authority distribution opportunities.
Under Internal Links, you can see which pages are receiving the most internal links — useful for confirming that your pillar pages are actually being linked to at the frequency the cluster structure requires.
For more on how to use this data as part of an ongoing measurement system, see building an SEO dashboard in Looker Studio and leading vs lagging SEO indicators.
A Worked Example
A mid-sized B2B services site ran the striking-distance filter for the first time and found 34 keywords sitting between positions 5 and 12, collectively generating over 40,000 monthly impressions but very few clicks. The team picked the top 10 by impression volume and made targeted improvements: adding missing subsections, refreshing outdated statistics, and adding 2–3 internal links from related pages to each target page.
No new pages were published. Within six weeks, 7 of the 10 pages moved into the top 5 positions for their target query, and organic clicks to those pages rose by a combined 64%. The exercise took roughly two days of writer and SEO time — a far smaller investment than producing new content, with a faster and more predictable payoff because the pages already had partial ranking signal to build on.
Frequently Asked Questions
Search Console Is Already Telling You What to Do
The data is there. Most sites aren’t using it — they’re looking at the surface numbers and missing the specific page- and keyword-level signals that point to the highest-leverage improvements available right now.
If you’d like help running a structured Search Console audit and building a monthly reporting cadence around the findings, get in touch.