
GA4 for SEO: The Reports and Events Worth Your Time
GA4 buries the useful stuff. Learn which reports, events and explorations actually help with SEO—and how to set them up so you measure what matters.
GA4 replaced Universal Analytics with a different data model — event-based rather than session-based — and in doing so buried most of the organic search analysis that was straightforward in UA. The default reports don’t surface what SEO practitioners actually need, and the interface takes some navigating before you find the useful parts.
This guide skips the orientation and goes straight to the GA4 reports, explorations, and events that produce actionable SEO insight. Each section covers what to find, what to look for, and what to do with the data, plus a worked example of how one site used this exact setup to find a conversion problem Search Console alone couldn’t see.
The Short Version
GA4 doesn’t show keyword data — that’s what Search Console is for. What GA4 shows is what happens after the click: Traffic Acquisition and Landing Pages reports for sessions and engagement by page, the Events report for scroll depth and CTA clicks, a free-form exploration combining landing page with conversions, and a Path Exploration to see whether organic visitors move through your site or bounce at the entry page. Set up form-submit and CTA-click events as conversions, or GA4 can’t connect your organic traffic to business outcomes at all.
Table of Contents
| Report / view | What it shows | What to look for |
|---|---|---|
| Traffic Acquisition + Landing Page | Organic sessions by page | High sessions, poor engagement |
| Landing Pages (filtered to organic) | Engagement and conversion by entry page | High sessions, low conversion rate |
| Events report | Scroll depth, clicks, custom conversions | Low scroll completion on long-form pages |
| Free-form exploration | Landing page + conversions in one view | Pages with traffic but no commercial outcome |
| Path Exploration | What organic visitors do after landing | High exit rate with no further navigation |
The Reports Worth Opening
Acquisition → Traffic Acquisition (Channel Groupings)
The Traffic Acquisition report shows sessions broken down by channel — Organic Search, Direct, Paid, Referral, etc. For SEO purposes, the key is setting the secondary dimension to “Landing Page” and filtering to Organic Search. This gives you a list of pages by organic sessions — the most direct view of which content is driving search traffic.
What to look for: pages with high organic sessions and poor engagement rate (under 50%) or short average engagement time (under 30 seconds). These are pages that are attracting organic clicks but failing to hold attention — likely a content-intent mismatch or a poor above-the-fold experience. Cross-reference with Search Console to see which keywords are landing on these pages.
Engagement → Landing Pages
The Landing Pages report shows which pages visitors enter the site on, with engagement metrics. Add the “Session Source / Medium” dimension and filter for “google / organic” to isolate SEO entry points.
Useful columns to add: Sessions, Engaged Sessions, Engagement Rate, Conversions, Session Conversion Rate. Sort by Sessions descending. The pages with high sessions and low conversion rates are the highest-priority conversion optimisation targets — they have the audience; something on the page is preventing the next step.
Engagement → Events
The Events report shows which events are firing on your site. For SEO insight, the events worth monitoring are: scroll (what percentage of organic visitors are scrolling to 90% of the page), click (are visitors clicking the CTAs?), and any custom events set up for form submissions, quote requests, or other conversion actions.
If the scroll event shows that fewer than 40% of organic visitors reach 90% of a long-form page, the content is either not holding attention or the page is so long that few readers reach the end. Either diagnosis points to action.
Explorations Worth Building
Free-Form Exploration: Organic Path Analysis
Build a free-form exploration with these settings:
- Segments: Organic Traffic (Google / organic)
- Dimensions: Landing Page, Session Default Channel Group
- Metrics: Sessions, Engaged Sessions, Conversions, Session Conversion Rate
This gives you a clean view of organic traffic by entry page with conversion data attached. Save it — this is the report you’ll open most in an ongoing SEO measurement routine.
Path Exploration: What Organic Visitors Do After Landing
In Explore → Path Exploration, set the starting point to “First touch” → Session Medium “organic.” This shows what organic visitors do after arriving — which pages they visit next, where they exit. For sites with a content library, this tells you whether visitors are moving through the cluster structure or exiting at the landing page.
If the path shows the vast majority of organic visitors leaving at the landing page with no subsequent navigation, internal link placement or content-to-CTA flow is likely the problem — not the traffic quality.
Events to Set Up If You Haven’t
GA4’s automatic events cover the basics (sessions, pageviews, scrolls, clicks on external links). For SEO measurement, the custom events worth adding:
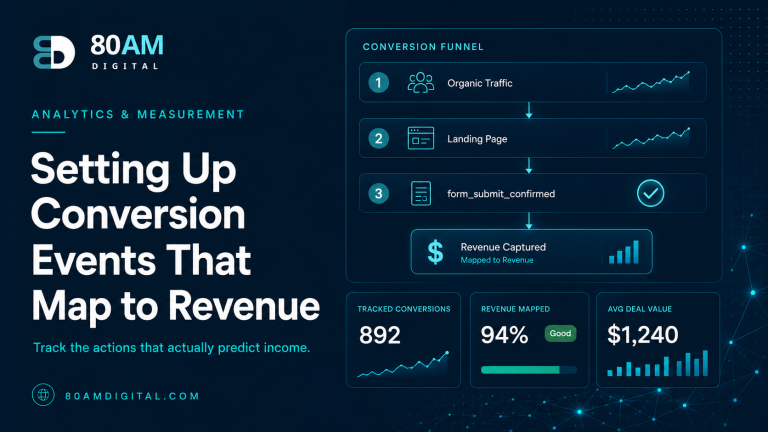
- Form submit confirmation — track the thank-you page or confirmation event so form fills are counted as conversions, not just page views
- CTA click (service page) — track clicks on your primary service page CTAs as a micro-conversion to understand which organic pages funnel visitors toward the service pages most effectively
- Blog CTA engagement — if your blog posts have CTAs at the bottom, tracking clicks on them ties content performance to commercial intent
Without these events marked as conversions in GA4, the platform has no way to connect your organic traffic to business outcomes — which means your reporting shows traffic but not whether that traffic is worth anything.
For the measurement system these reports feed into, see building an SEO dashboard in Looker Studio and for more on Search Console to pair with GA4, see the underused Search Console reports.
A Worked Example
A B2B software company saw Search Console showing healthy and growing impressions and clicks across its blog, but flat demo-request volume quarter over quarter. The two data sources told contradictory stories, and nobody could explain why until the team built the free-form organic exploration described above.
The exploration showed that organic sessions were concentrated on roughly 15 blog posts, all with healthy engagement rates above 60% — readers were genuinely reading. But the session conversion rate on every one of those 15 pages was under 0.5%, against a site average of 2.1% on commercial pages. A Path Exploration confirmed why: almost none of the blog traffic ever navigated onward to a service or demo page. The blog had no CTA driving that next step.
The fix was a standardised blog CTA block, tracked as its own GA4 event, added to all 15 posts. Within two months, session conversion rate on those pages rose to 1.3%, and demo requests attributable to organic blog traffic, previously near zero, became a measurable contributor. Search Console had shown the traffic was there all along; GA4 was the only place that showed it wasn’t converting, and why.
Frequently Asked Questions
Measure What SEO Is Actually Producing
GA4 isn’t intuitive for SEO — but the data is there. The key is knowing which reports to build, which events to track, and what to look for in the numbers rather than relying on the default dashboard, which tells you very little about whether your SEO is working.
If you’d like help setting up a GA4 configuration that ties organic traffic to conversions and revenue, get in touch.