
What to Include in a Monthly SEO Report
A monthly SEO report should tell a clear story about what changed, why it changed, and what’s next — not just dump metrics. Here’s what to include and what to leave out.
A monthly SEO report has two audiences: the practitioner producing it (who needs it to be a useful diagnostic tool) and the stakeholders receiving it (who need it to answer “is it working, and what’s next?”). Most SEO reports serve only the first audience — they’re data exports with some charts attached, produced for completeness rather than communication. A report that serves both audiences is shorter, more useful, and more likely to result in the decisions and resource allocation that SEO actually needs.
This article covers the five sections every monthly SEO report needs, what to deliberately leave out, and a worked example of how one team turned a vague “traffic is down” report into a specific, trust-building one.
The Short Version
A monthly SEO report needs five sections: performance summary, ranking and visibility trends, content performance, technical health, and actions for next period. Leave out Domain Authority, full keyword tables, raw backlink counts, and impressions without context — none of these help a stakeholder make a decision. The report’s job is to enable decisions, not document activity: every section should end with an interpretation, not just a number. Use two formats — a 4–8 page practitioner report and a 1-page executive summary — rather than forcing one document to serve both audiences.
Table of Contents
The Five Sections of a Monthly SEO Report
| Section | Answers | Audience |
|---|---|---|
| 1. Performance summary | Is organic search performing? | Both |
| 2. Ranking & visibility trends | Where are we gaining or losing ground? | Practitioner, summarised for execs |
| 3. Content performance | What content is driving the result? | Practitioner |
| 4. Technical health | Are there issues blocking growth? | Practitioner, flagged for execs only if material |
| 5. Actions & next period | What’s being done about it? | Both |
1. Performance Summary (Organic Traffic and Conversions)
This is the headline section: how did organic search perform this month versus last month and versus the same month last year? Month-on-month comparisons are useful for spotting recent changes; year-on-year comparisons correct for seasonality. Include:
- Organic sessions (month, MoM%, YoY%)
- Organic conversions or leads (month, MoM%, YoY%)
- Organic revenue or conversion value if tracked
- One-sentence interpretation: “Organic traffic is up 12% YoY; lead volume from organic is up 8% YoY, slightly lagging traffic growth, which we’re investigating in the content performance section.”
2. Ranking and Visibility Trends
A snapshot of your target keyword portfolio performance. Not individual keyword rankings for every tracked term — a curated view of the most strategically important queries and their trend direction. Include:
- Average position for your defined target keyword set (20–50 strategically important non-branded queries)
- Total impressions (Search Console, MoM comparison)
- Average CTR (Search Console, MoM comparison)
- Top movers: which keywords moved most significantly up or down, and why
3. Content Performance
Which content pages are driving the most organic sessions and conversions, and is that changing? This section identifies where the organic value is concentrated and whether new content is contributing. Include:
- Top 10 pages by organic sessions this month
- Top pages by organic conversions (may be a different list)
- New content published this month and its initial performance (indexed? ranking? early traffic?)
- Any content refreshes implemented and their impact on rankings or traffic
4. Technical Health
A brief status check on technical issues that affect crawlability and indexation. This section belongs in the practitioner report; for the executive report, only surface items that have been resolved or have a significant impact. Include:
- Search Console coverage: total indexed pages, any new errors flagged
- Core Web Vitals pass rate (if changing)
- Any crawl issues, manual actions, or security warnings (flag immediately, don’t wait for the monthly report)
- Technical fixes implemented this month and their outcome
5. Actions and Next Period
The section that answers “so what?” — what was done this month, what did it produce, and what’s planned for next month. This is the most important section for accountability and planning. Include:
- Key actions completed this month (content published, technical fixes deployed, links acquired)
- Expected impact and timeline for each action
- Planned actions for next month and their expected contribution
- Any changes to strategy or prioritisation and the reason
What to Omit
Domain Authority and Domain Rating (third-party metrics that don’t require monthly monitoring and that most stakeholders can’t action). Full keyword ranking tables (too granular; the trend summary is the signal). Backlink counts without context (the number of backlinks is less important than whether they’re from relevant, authoritative sources — include only when new link acquisition is a specific focus). Impressions without explaining whether they matter (growing impressions with declining CTR is a zero-click signal, not a success; flat impressions with growing clicks is real progress — context is everything).
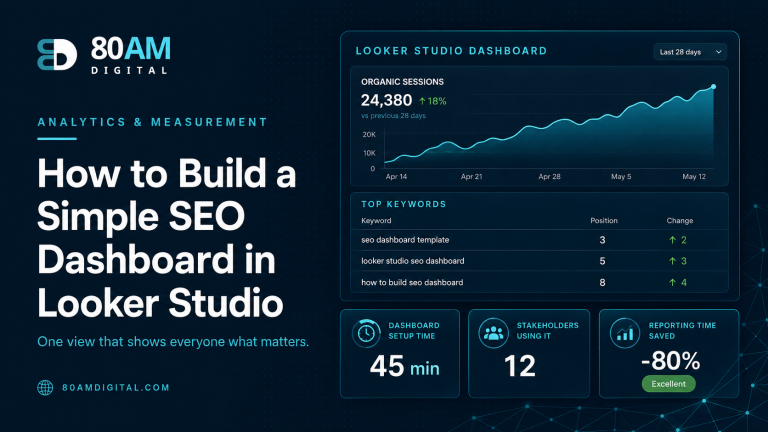
For the executive version of this report (shorter, more business-outcome focused), see reporting SEO to executives. For how to build a Looker Studio dashboard that populates this report automatically, see SEO dashboard in Looker Studio.
A Worked Example
An industrial equipment distributor’s SEO reports had been a 12-page PDF export from three different tools, sent to a stakeholder group that included the CMO and the head of sales. Engagement was low — the CMO admitted she mostly skipped to the last page, and the head of sales had stopped opening the report at all after a bad month produced a wall of declining charts with no explanation.
The team rebuilt the report into the five-section structure and split it into two formats: a 1-page executive summary emailed directly in the body of the message (no PDF to open) and a linked practitioner report for anyone who wanted detail. The next month happened to be a bad one — organic sessions fell 14% following a core update. Instead of a wall of declining charts, the executive summary led with: “Organic sessions declined 14% MoM following the March core update. Affected pages are concentrated in our product comparison category. Lead volume from organic declined only 4%, suggesting our highest-intent pages were largely unaffected. We’ve identified the content gaps causing the decline and have a fix scheduled for next month.”
The CMO replied within the hour — not with alarm, but with a question about the comparison category fix, which the team could answer specifically because the report had already named the cause. Three months later, when the team needed to request budget for an additional content specialist, the head of sales backed the request in the stakeholder meeting, citing the reporting as the reason he trusted the team’s read on what was and wasn’t working.
Frequently Asked Questions
Report for Decisions, Not Documentation
The purpose of a monthly SEO report is to enable decisions: should we continue this content investment? Is the technical work delivering results? Does the ranking trend suggest an algorithm impact we need to respond to? A report that answers these questions — in plain language, with enough data to support the conclusions — is more valuable than a comprehensive data export that requires specialist interpretation. The measure of a good SEO report is not how complete it is but how clearly it communicates what’s happening and what to do about it.
If you’d like help building an SEO reporting structure that keeps your team and stakeholders aligned, get in touch.