INP: Why Sites Fail It & How to Fix It
Table of Contents
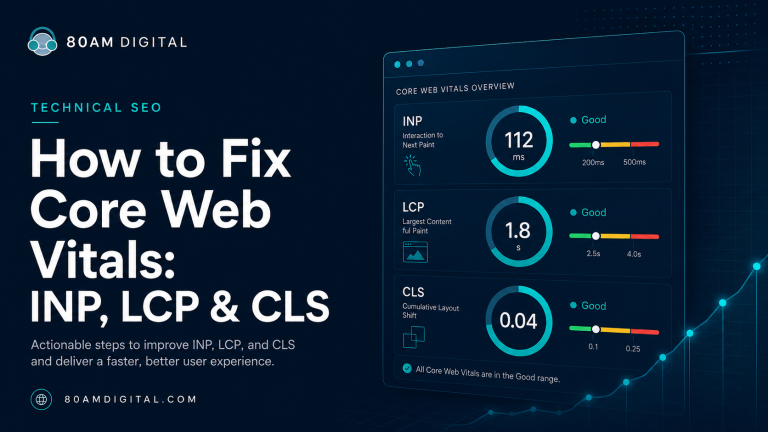
INP (Interaction to Next Paint) is the Core Web Vital most sites fail—reports put the failure rate above 40%. It measures how quickly your page responds to every interaction, and “Good” means 200 milliseconds or less at the 75th percentile of real users. Unlike loading problems, you almost never fix INP with caching or a CDN: the cause is JavaScript tying up the main thread, so the fixes are code-level.
If you’ve worked through our Core Web Vitals playbook and INP is the metric still in the red, this is the deeper dive. It’s also one phase of a full technical SEO audit.
What INP measures (and why it replaced FID)
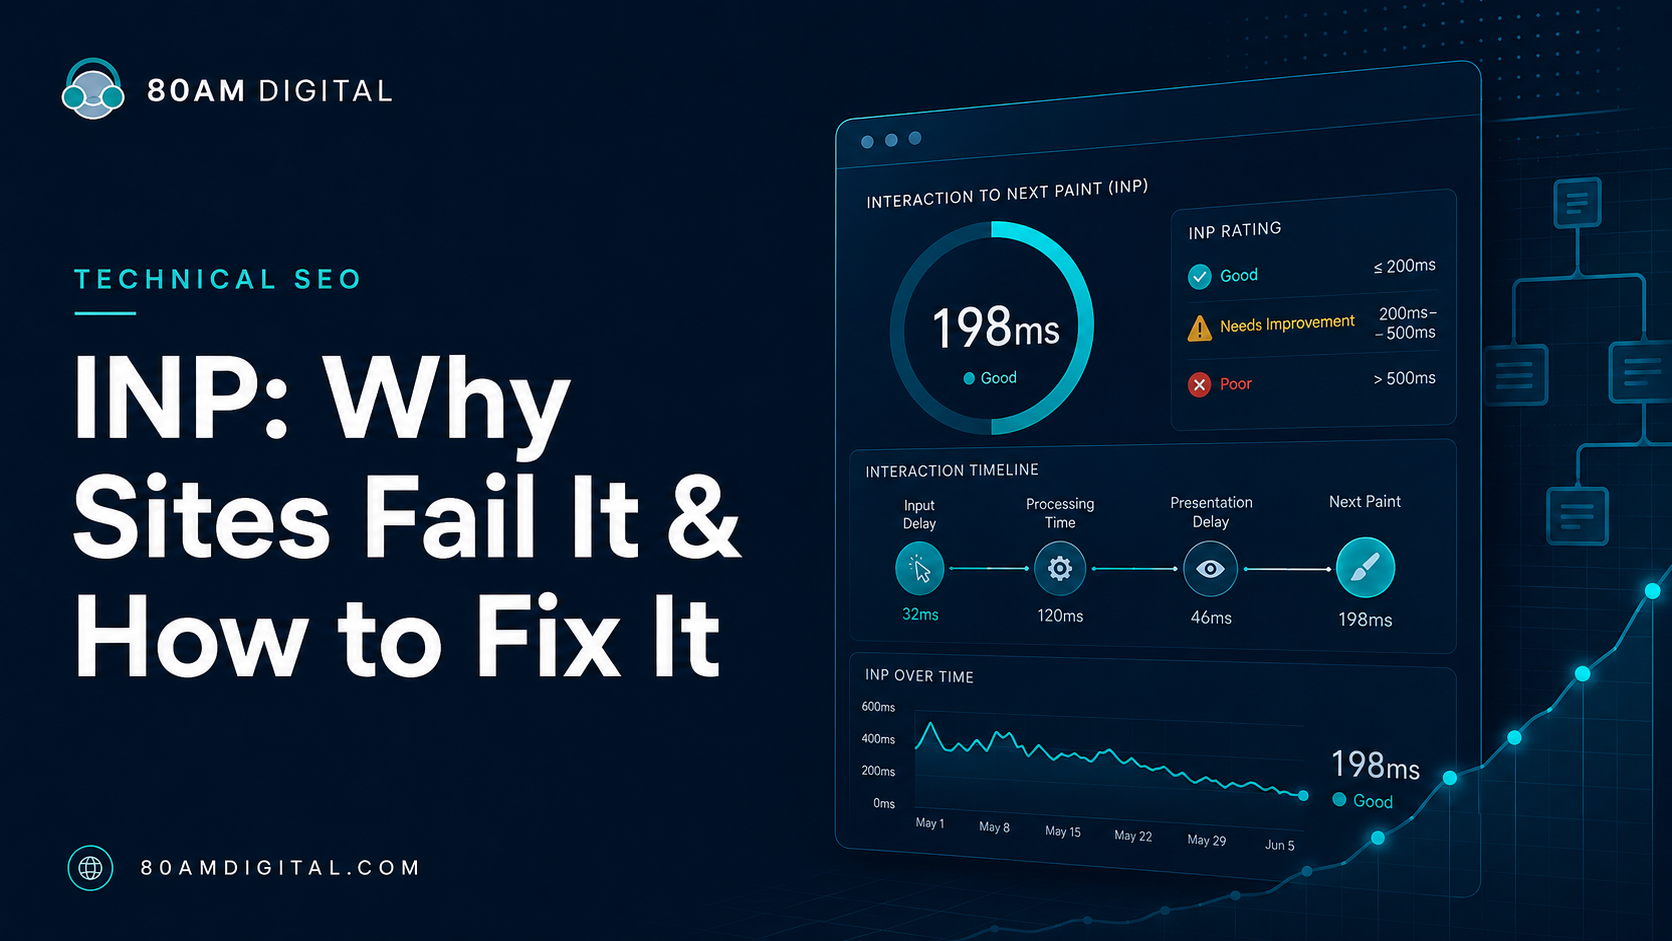
INP records the latency of interactions throughout the entire time someone is on the page—taps, clicks, and key presses—and reports a value close to the worst one. It became a Core Web Vital in March 2024, replacing First Input Delay (FID).
That swap matters. FID only measured the delay before the browser started handling your very first interaction—a low bar most sites cleared. INP measures the full round trip (delay, processing, and repaint) across all interactions, so it reflects what using the page actually feels like. It’s a fairer metric, and a much harder one to pass.
The three parts of every interaction
Every interaction has three phases, and INP is the sum of all three. Diagnosing INP means working out which phase is slow, because each has different fixes.
| Phase | What’s happening | Where the fix lives |
|---|---|---|
| Input delay | The main thread is busy with other work, so the browser can’t even start handling your tap or click yet. | Break up long tasks; defer JavaScript during load |
| Processing time | Your event handlers and callbacks are running. | Optimize handlers; yield to the main thread; offload work |
| Presentation delay | The browser is recalculating styles and layout and painting the next frame. | Shrink the DOM; reduce rendering work |
The three sections below map directly onto these phases.
Why most sites fail INP
The modern web ships a lot of JavaScript, and JavaScript runs on the same single main thread that handles interactions. When a script is busy, the page can’t respond. The usual offenders:
- Heavy first-party JavaScript — large bundles and hydration work that keep the main thread busy right when people start interacting.
- Third-party scripts — tag managers, chat widgets, A/B testing tools, and analytics that run on every interaction.
- Expensive event handlers — handlers that do real work synchronously on every click or keystroke.
- A large, complex DOM — the more nodes the browser has to restyle and lay out, the longer the repaint.
How to find your slow interactions
- Confirm it in the field. Check the Search Console Core Web Vitals report and the field data in PageSpeed Insights to see which URL groups fail INP and on which device.
- Reproduce it live. Install the Chrome Web Vitals extension, open a failing page, and click around the way a visitor would. The extension shows the INP value and the specific element you interacted with.
- Find the long task. Record in the DevTools Performance panel while you repeat the slow interaction. Look for the long task (anything over ~50ms) blocking the main thread, and check whether the time is going into input delay, processing, or presentation.
Fix input delay
Input delay is highest right after load, when scripts are initializing and the main thread is swamped. The goal is to keep the thread free so the browser can react the instant someone interacts.
- Break up long tasks. Split heavy initialization into smaller chunks so no single task monopolizes the thread.
- Defer non-critical JavaScript. Load what the first screen needs; postpone the rest until after the page is interactive.
- Delay third-party scripts. Load chat, analytics, and A/B tools after interactivity—or only when a user triggers them—rather than during the initial render.
Fix processing time
This is the work your own code does in response to the interaction. If a handler runs long, the page freezes until it finishes.
- Yield to the main thread. Inside a long handler, hand control back to the browser so it can paint—using
scheduler.yield()where available, orawait/setTimeoutas a fallback—then continue the work. - Do less on the critical path. Update the UI the user is waiting on first, and defer everything non-urgent (logging, analytics, prefetching) with
requestIdleCallback. - Debounce noisy handlers. For input, scroll, and resize events, debounce or throttle so you’re not running expensive work on every event.
- Offload heavy computation. Move genuinely heavy work (parsing, sorting large data) into a web worker so it never touches the main thread.
- Give immediate feedback. Show a pressed or loading state the moment someone acts, so the next paint lands fast even if work continues behind it.
Fix presentation delay
Once your code finishes, the browser still has to recalculate styles and lay out and paint the next frame. A heavy page makes that step slow.
- Shrink the DOM. Fewer, simpler nodes mean cheaper style and layout work on every frame. Watch out for deeply nested builders and page-builder bloat.
- Skip off-screen rendering. Use
content-visibility: autoon long, below-the-fold sections so the browser doesn’t render what isn’t visible yet. - Avoid layout thrash. Don’t read and write layout properties in a loop; batch DOM changes, and animate with
transformandopacityinstead of properties that trigger layout.
Hold INP down as you ship
INP regresses quietly—usually the day a new third-party script or feature ships. Keep it down with a few habits:
- Set a JavaScript and long-task budget for key templates, and check it before each release.
- Review every new third-party tag before it goes live—each one runs on your users’ main thread.
- Re-check field data about a month after a fix, since INP is reported from a rolling 28-day window of real users.
INP is one phase of a wider review of crawlability, indexing, content, and conversion. Want the full picture? Work through the SEO Audit Checklist—or have us run it for you.